5. Reports
The Reports feature provides users with comprehensive insights into data distribution and quality through global insights and composition charts. It offers a summary of key data processing metrics over a selected duration enabling users to explore high-level data distribution, monitor system performance, track growth trends, evaluate operational efficiency, and analyze entity relationships. To access these insights, navigate to Reports from the left-side menu.
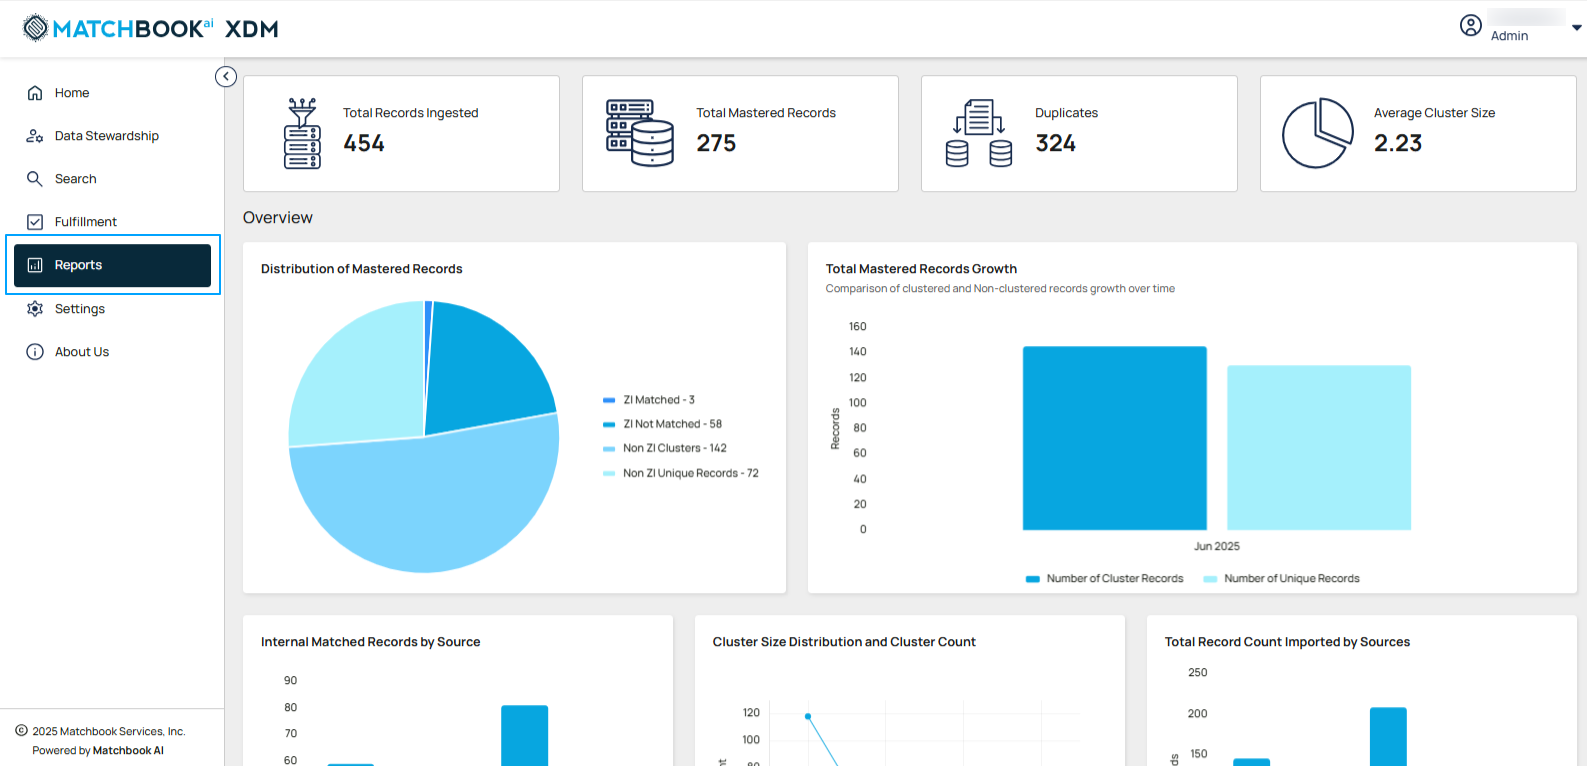
Key performance indicators (KPIs) such as Total Records Ingested, Total Mastered Records, Duplicates, and Average Cluster Size show value trends that highlight increases or decreases over time.
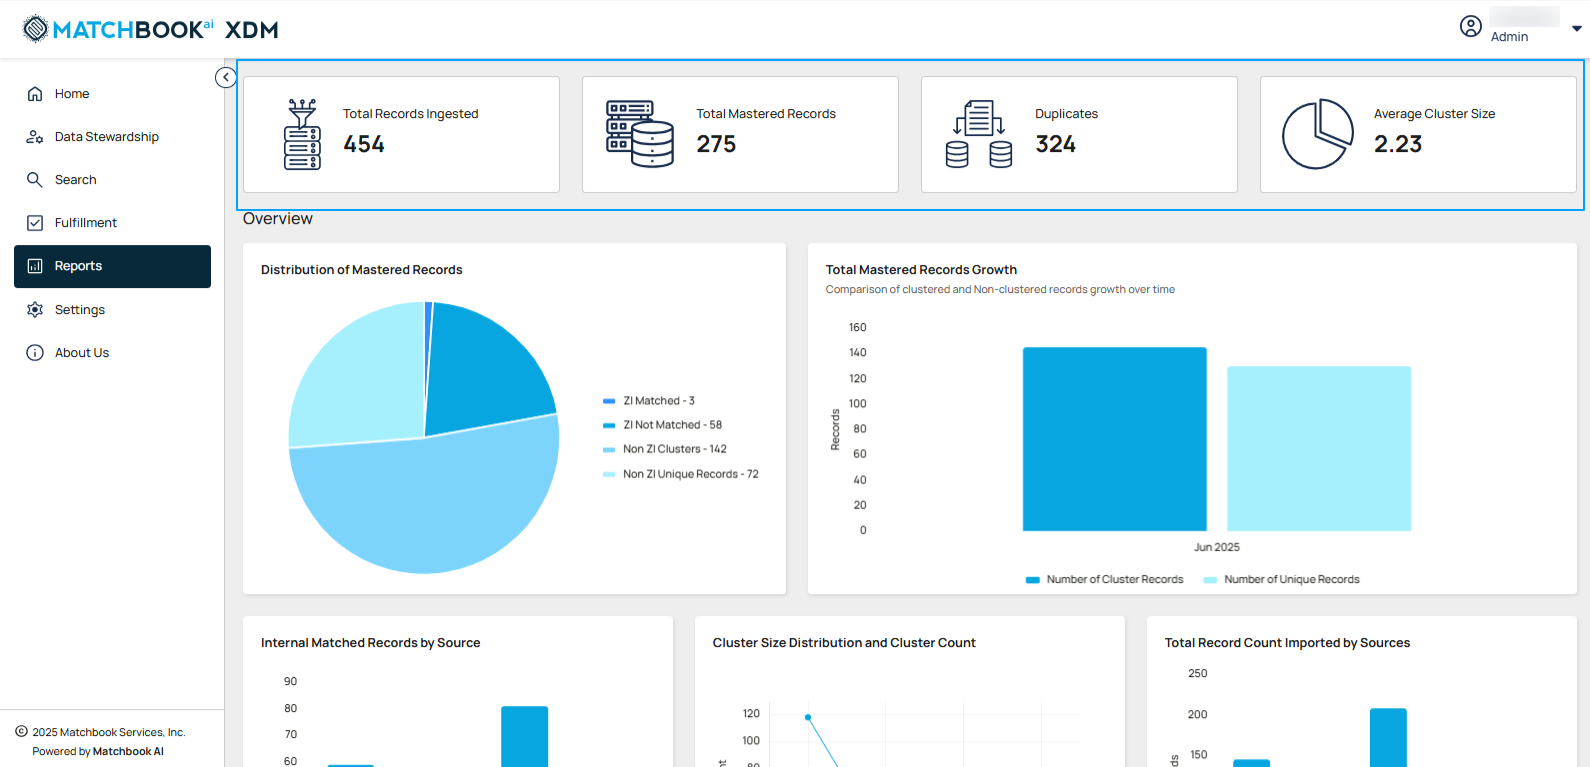
The table below gives the description of each filed:
Field |
Description |
|---|---|
Total Records Ingested |
Displays the total number of records added to the system. |
Total Mastered Records |
Shows the count of records that have been matched, merged, and enriched into a master entity. |
Duplicates |
Indicates the number of records identified as potential duplicates during the data mastering process. |
Average Cluster Size |
Shows the average number of records per cluster. |
The Overview section provides a comprehensive snapshot of mastered data activity and quality across the platform. It includes visual metrics and insights to help users understand the performance, trends, and integrity of their data over time.
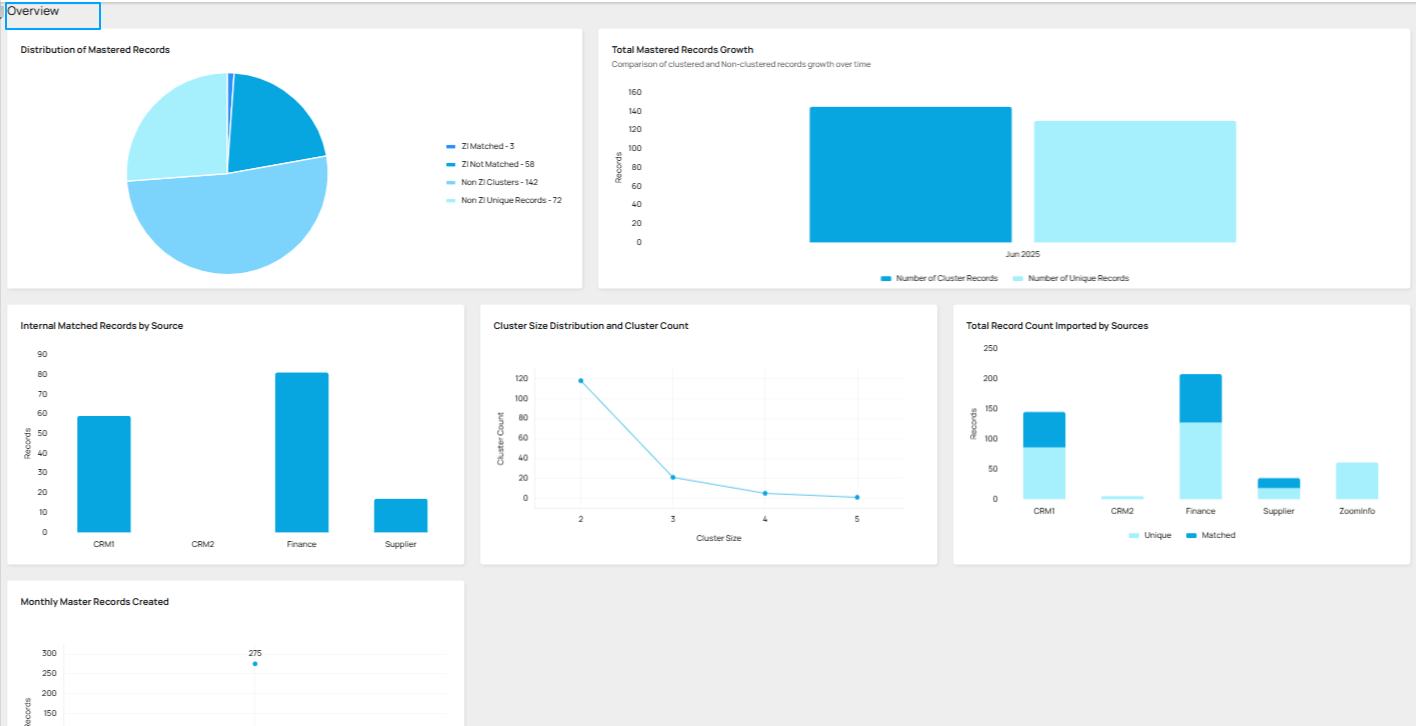
The table below shows the different metrics and their description:
Metric |
Description |
|---|---|
Distribution of Mastered Records |
Categorizes records by matching status, showing data quality and clustering insights. |
Total Mastered Records Growth |
Bar chart depicting continuous growth of mastered records over time. |
Internal Matched Records by Source |
Shows the count of matched records categorized by source. |
Cluster Size Distribution and Cluster Count |
Provides insights into cluster groupings. |
Total Record Count Imported by Sources |
Displays the total number of records processed and categorized by individual data sources. |
Monthly Master Record Created |
Tracks the number of new master records generated each month. |
Zoom Info or Internal: Provides metrics related to either Zoom Info or Internal data sources, based on the user’s selection, enabling tailored insights. Switch between Zoom Info and Internal for detailed analysis.
5.1 Zoom Info
On the right-hand side, beside Select Duration, select the duration from the drop-down menu. It focuses on specific metrics within the time frame chosen by the user, allowing for detailed temporal analysis.
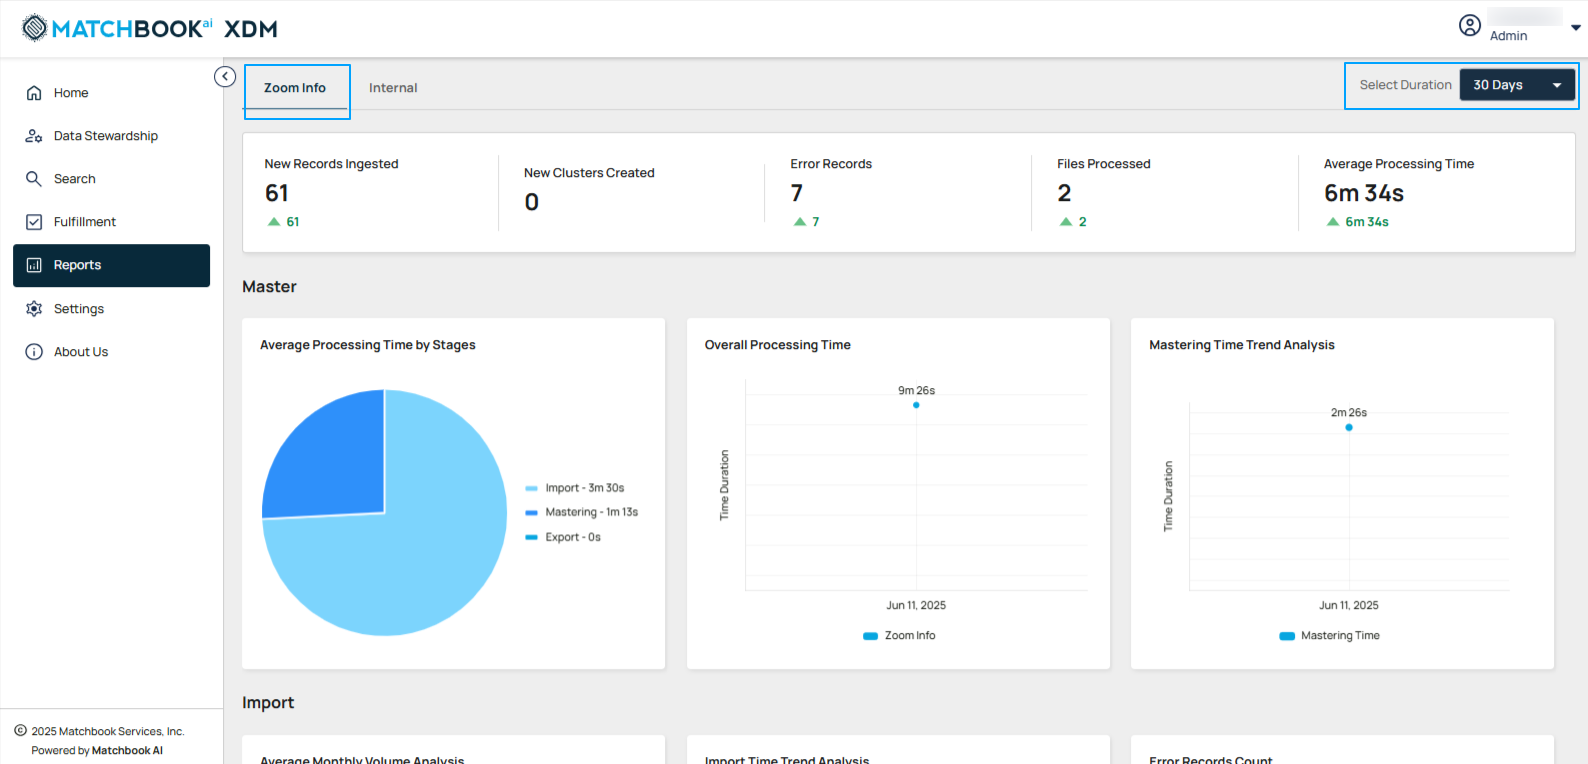
The table below shows the metrics and their description:
Field |
Description |
|---|---|
New Records Ingested |
Displays the total number of records imported. |
New Clusters Created |
Number of new entity groups formed based on matched or similar records. |
Error Records |
Count of records that failed processing due to validation or matching errors. |
Files Processed |
Total number of data files successfully handled during the ingestion process. |
Average Processing Time |
Average time taken to process each file or record during ingestion. |
Master-Specific Charts
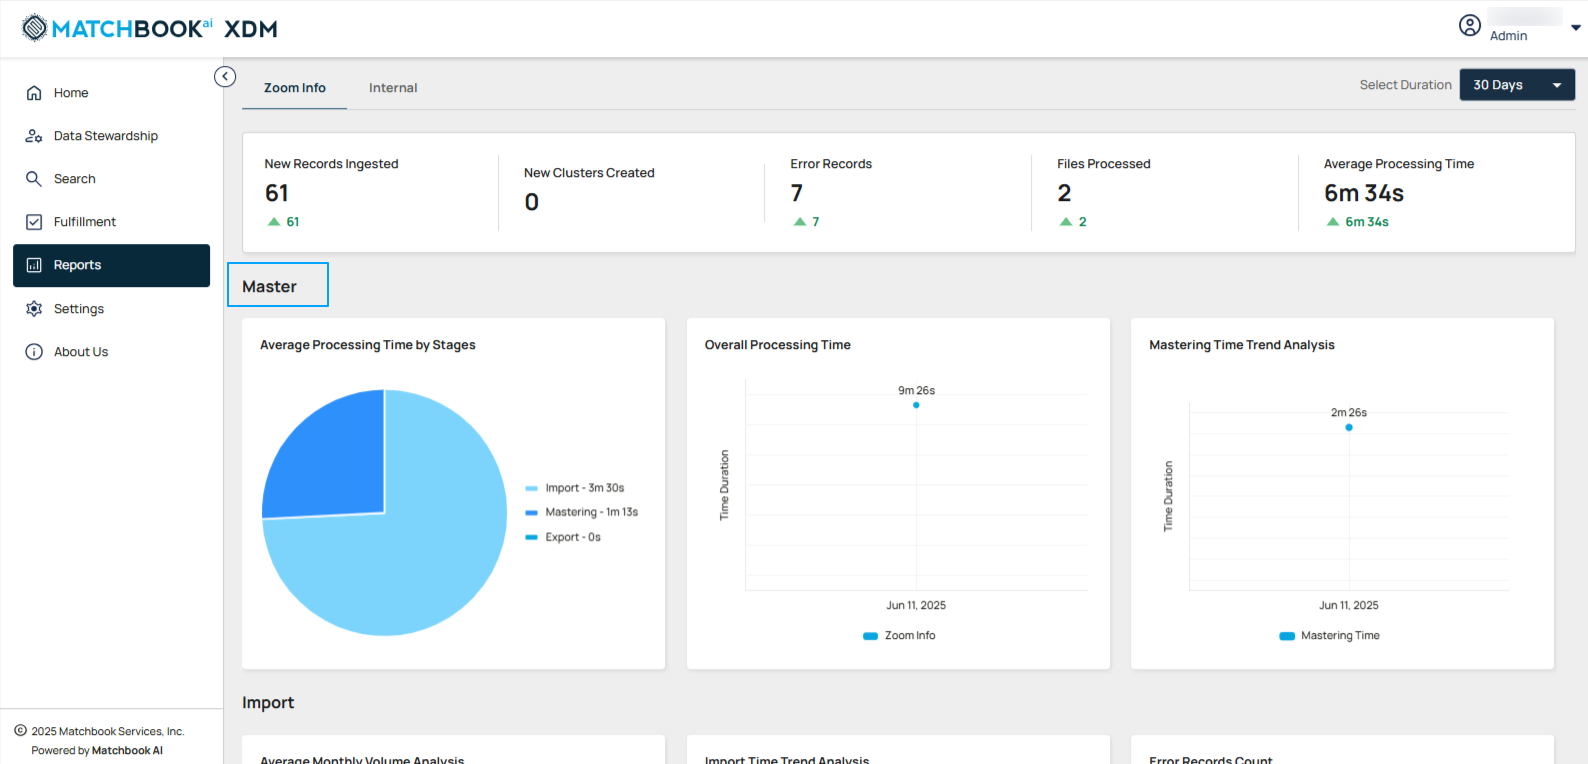
The table below shows the metrics and their description:
Chart |
Description |
|---|---|
Average Processing Time by Stages |
Highlights the time spent on Import, Mastering, and Export stages. |
Overall Processing Time |
Shows the total time taken for end-to-end processing. |
Mastering Time Trend Analysis |
Analyzes the trend of mastering times over a given period, helping to identify improvements or fluctuations in the efficiency of data mastering processes. |
Import-Specific Charts
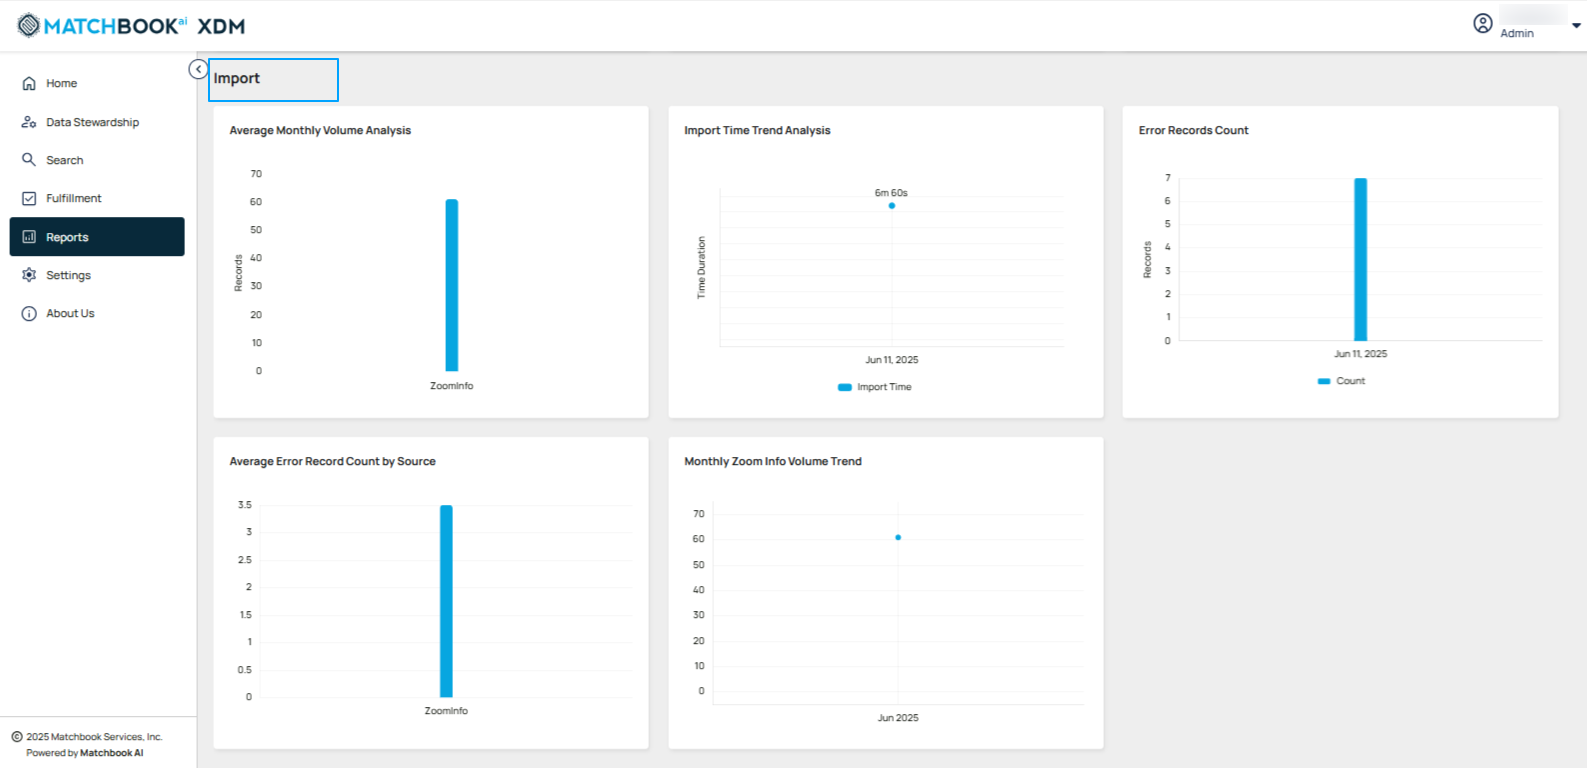
The table below shows the metrics and their description:
Chart |
Description |
|---|---|
Average Monthly Volume Analysis |
Displays the record count per source name, providing insights into the monthly data volume across different sources. |
Import Time Trend Analysis |
Analyzes trends in the time taken for data imports over a specific period. |
Error Records Count |
Displays the count and rate of errors over time. |
Average Error Record Count by Source |
Highlights the average error count per source. |
Monthly Zoom Info Volume Trend |
Shows the monthly average of Zoom Info data volume. |
5.2 Internal
On the right-hand side, beside Select Duration, select the duration from the drop-down menu. It focuses on specific metrics within the time frame chosen by the user, allowing for detailed temporal analysis.
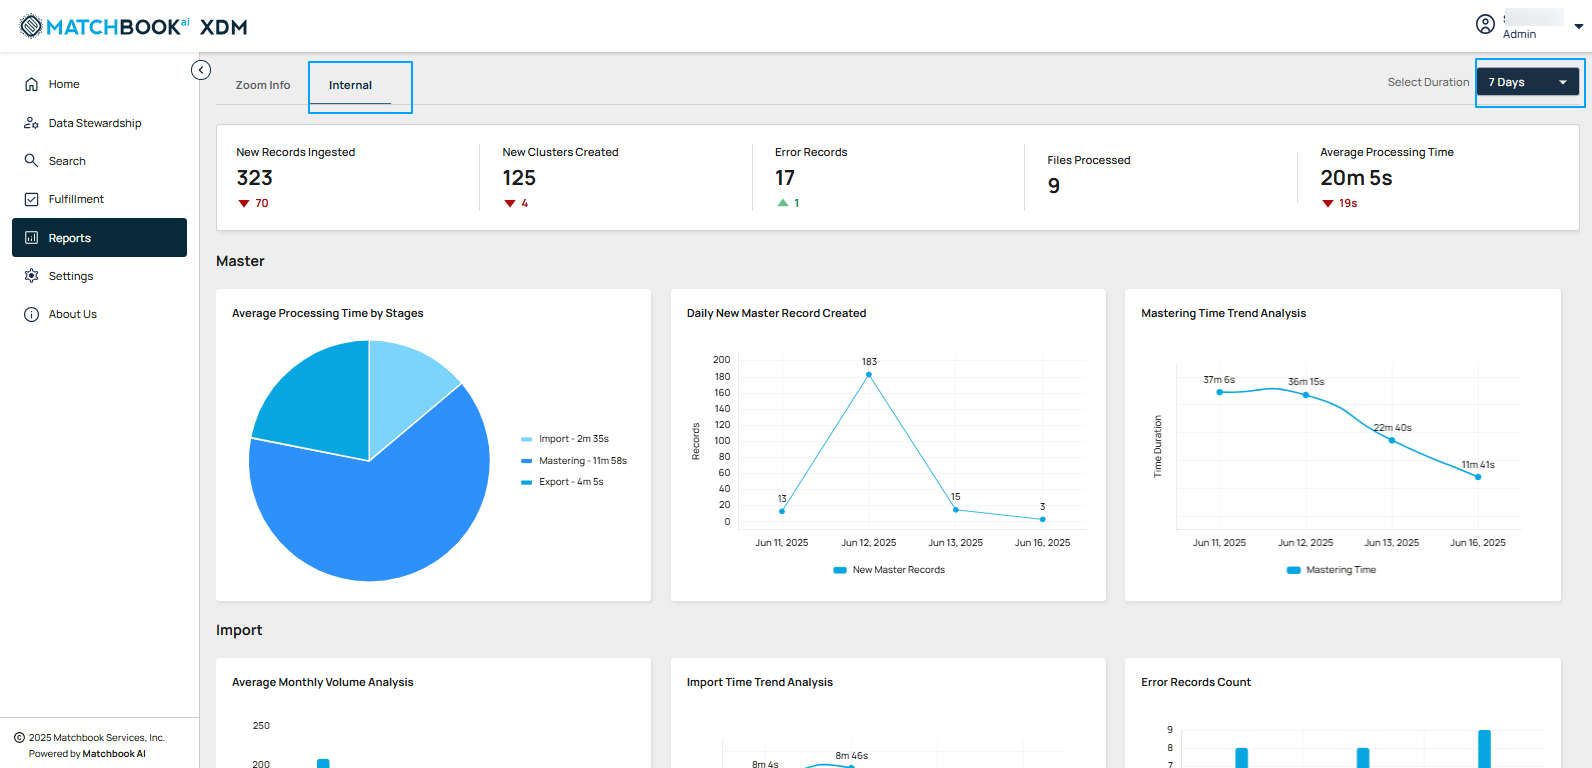
The table below shows the metrics and their description:
Field |
Description |
|---|---|
New Records Ingested |
Displays the total number of records imported. |
New Clusters Created |
Number of new entity groups formed based on matched or similar records. |
Error Records |
Count of records that failed processing due to validation or matching errors. |
Files Processed |
Total number of data files successfully handled during the ingestion process. |
Average Processing Time |
Average time taken to process each file or record during ingestion. |
Master-Specific Charts
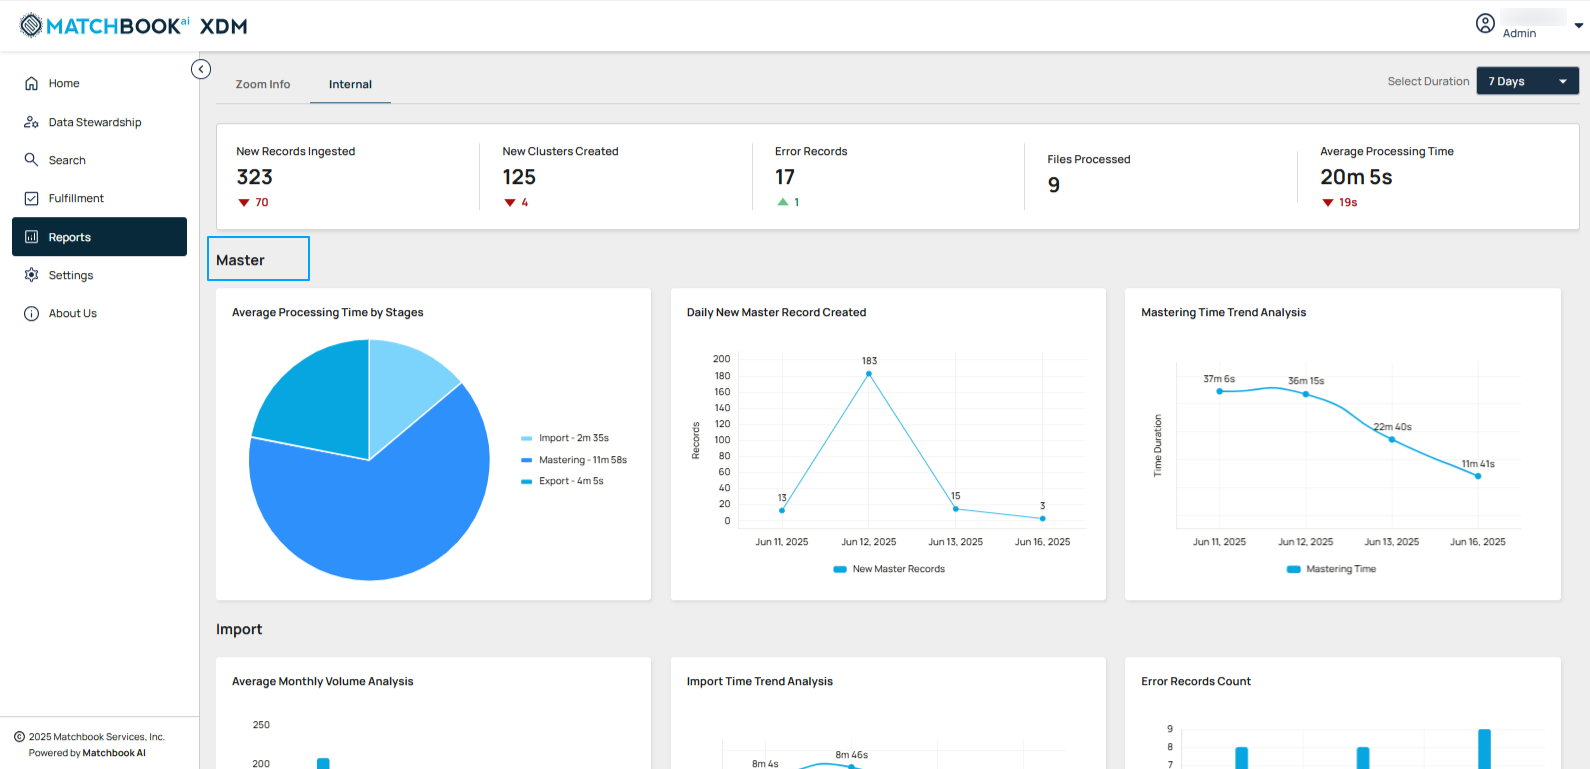
The table below shows the metrics and their description:
Chart |
Description |
|---|---|
Average Processing Time by Stages |
Highlights the time spent on Import, Mastering, and Export stages. |
Daily New Master Record Created |
Displays the number of new master records generated each day. |
Mastering Time Trend Analysis |
Analyzes the trend of mastering times over a given period, helping to identify improvements or fluctuations in the efficiency of data mastering processes. |
Import-Specific Charts
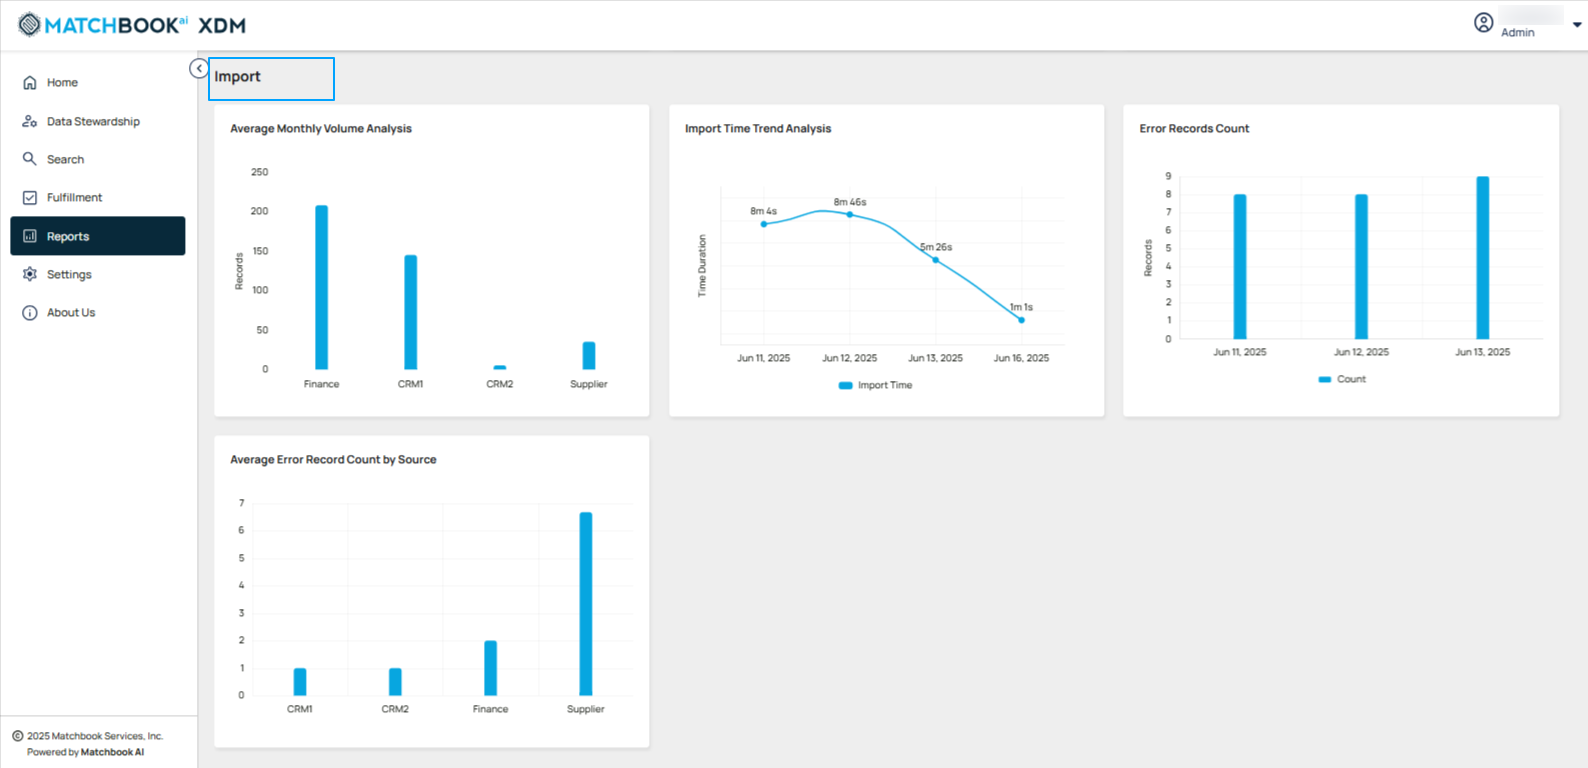
The table below shows the metrics and their description:
Chart |
Description |
|---|---|
Average Monthly Volume Analysis |
Displays the record count per source name, providing insights into the monthly data volume across different sources. |
Import Time Trend Analysis |
Analyzes trends in the time taken for data imports over a specific period. |
Error Records Count |
Displays the count and rate of errors over time. |
Average Error Record Count by Source |
Highlights the average error count per source. |